Senior Design-2023
Valencia College
PROGRESS LOG
Week 1: 08/23/2023-08/29/2023:
Group:
During the first week, we dedicated substantial time to designing a comprehensive website, ensuring it incorporates all the necessary tabs that are required for the senior design. Additionally, we conducted thorough research to explore various ideas that would be useful for the project. We came up with three distinct concepts, each accompanied by a designed block diagram outlining the essential components needed for implementation. In addition to this, we conducted thorough market research to gauge the potential marketability of each concept. To ensure clarity and coherence, we also composed concise explanations for each concept, providing a clear overview of its purpose, functionality, and potential benefits.
Alexis:
Conducted in-depth research on both Solar Panels and the innovative Greenhouse Capsule concept. Created a detailed diagram showing how they work together. Also, checked if there's a market for it and wrote a clear description of the product.
Leonardo:
Researched the Beach Kart concept and made a detailed diagram to show how it would work. Checked if people would be interested in buying it and wrote a brief description of the product.
Week 2: 08/30/2023-09/05/2023:
Group:
We expanded the senior design website by incorporating an additional tab, the Project Presentation tab. Additionally, we worked on creating comparison tables, that demonstrate our ideas with existing market products. A significant portion of our efforts was dedicated to researching how the greenhouse capsule could be tested in a timely manner. We also spent time investigating a new idea as we decided to not go forward with most of the previous ideas.
Alexis:
I went through the website and fixed any spelling or grammar mistakes to make sure everything reads smoothly. I also made sure the comparison tables were accurate and easy to understand. Additionally, I updated the Time and Effort table with more detailed information to give a better picture of what's involved
Leonardo:
I updated the progress log by including more detailed information about the tasks and steps we've completed so far. Additionally, I spent time working on creating a component diagram. This diagram is a visual representation that shows how different parts or components of our project work together. It helps us understand the bigger picture and ensures that everything fits together seamlessly. This step is crucial in ensuring the overall success and efficiency of our project.
Week 3: 09/06/2023-09/12/2023:
Group:
During the third week, our team was hard at work on several key tasks. We started by making necessary syntax corrections to the weekly meetings tab on our website, ensuring everything is clear and easy to understand. We also began filling in the Progress Log section to keep track of our project's development. To keep things organized, we created a new tab specifically for listing references and moved website links over to it. Additionally, we tackled the creation of a System Diagram for our fourth idea, providing a visual representation of how it will work. We also added relevant content to the Engineering Requirements tab, outlining the specific needs and criteria for our project. Lastly, we took steps towards creating a proposed budget for the fourth idea, setting the financial groundwork for its implementation. This week was all about making concrete progress towards our project goals.
Alexis:
I dedicated time to refine and specify the system requirements, which involves outlining exactly what our project needs to achieve and how it will do so. This step is crucial for ensuring that our final product meets all the necessary criteria.
Furthermore, I took steps to enhance the user experience on our website. I created a new section called the Link Reference tab, which serves as a convenient resource for users to easily navigate to relevant information or resources. This addition not only improves the accessibility of our website but also helps streamline the user's journey, making it more efficient and user-friendly.
Leonardo:
I dedicated significant time and effort towards refining our Engineering Specifications, which involves specifying in detail the technical requirements and standards that our project must meet. This step is crucial for ensuring that our final product functions optimally and meets all necessary criteria.
In addition, I delved into the budgetary aspect of our project. This involved meticulously analyzing and planning the financial resources needed to bring our project to fruition.
Week 4: 09/13/2023-09/19/2023:
Group:
During this week we worked on improving our project's block diagram to more clearly depict how our system shall work. Additionally, we created a new diagram that organizes the components into clear modules for better understanding.
Furthermore, we updated the technical requirements to reflect the changes in our project's components. Some of the components needed to be added and some were removed.
Research
Additionally, research was conducted on the advantages and disadvantages of using air and water cooling solutions. Because the components necessary to conduct our own tests are still under shipment we had to rely solely on research. The following is a summary of our findings [5]:
The Raspberry Pi 4 only allows the CPU temperature to go up to 80°C before it starts throttling the CPU performance to lower the temperature and prevent the CPU from heating up any further.
The test was conducted using three types of cooling solutions:
1-Using a heat sink placed on top of the CPU chip.
2-Using an air cooling system
3-Using a water cooling system
Putting the Raspberry Pie under stress (1.5kHz)The results were the following:
-
using only a heatsink the temperatures reached above 80 degrees Celsius before the CPU started to throttle.
-
using an air-cooling solution the temperatures dropped to 65 degrees Celsius.
-
and using a water-cooling solution the temperatures dropped even further to 32 degrees Celsius.
Below are the plotted graphs of the thermal response using each approach.
Heat-Sink
Air-cooled
Water-cooled
Based on these tests, it can be concluded that a water-cooled system is capable of maintaining CPU temperatures around 33 degrees Celsius (59.4° F)lower than conventional air-cooling systems.
Alexis:
Worked on correcting the Progress log to clearly specify the work that each member did during the previous weeks. Worked on fixing the Engineering requirements to clearly depict the intended project.
Leonardo:
Added citations to the website and their corresponding IEEE citations in the links tab. Worked on fixing the Engineering Specifications table to reflect the new components added and the ones removed.
Week 5: 09/20/2023-09/26/2023:
Group:
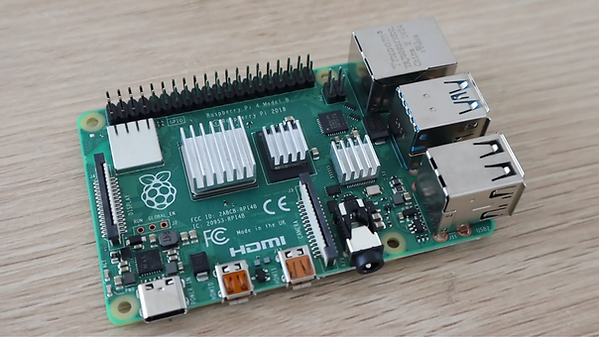
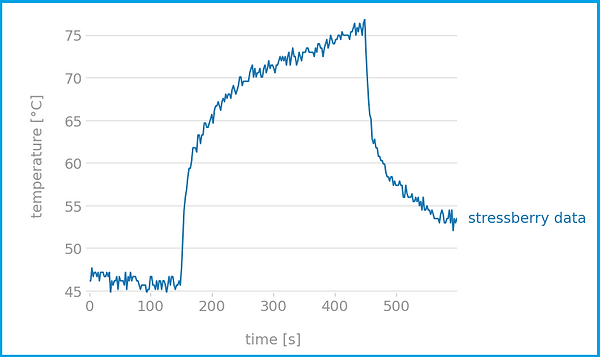
After much anticipation, the cooling blocks and other essential components for the pilot tests finally arrived. On Friday, we gathered with the purpose of conducting the initial assessment of water's effect on computer cooling. We began by performing a baseline test on the Raspberry Pi without any cooling solutions. The subsequent photos details the results obtained.
76°C or 168.8°F Using no Cooling System
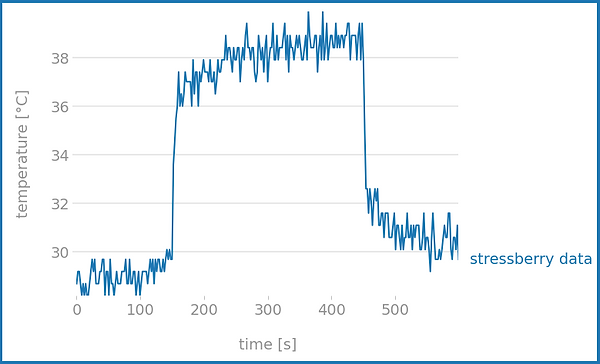
The test was conducted using Stressberry, and was run for 600 seconds, the CPU was overclocked to 1800MHz to obtain the resulting temperature readings.
Using no cooling solution the temperature peaked at 76°C or 168.8°F.
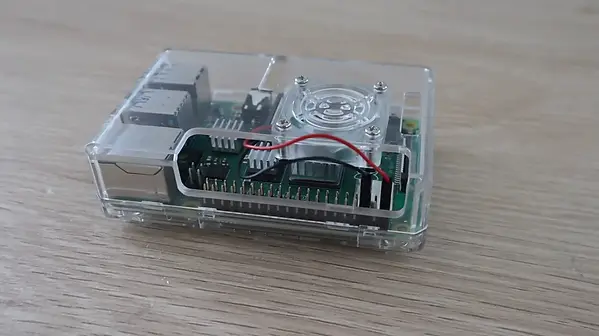
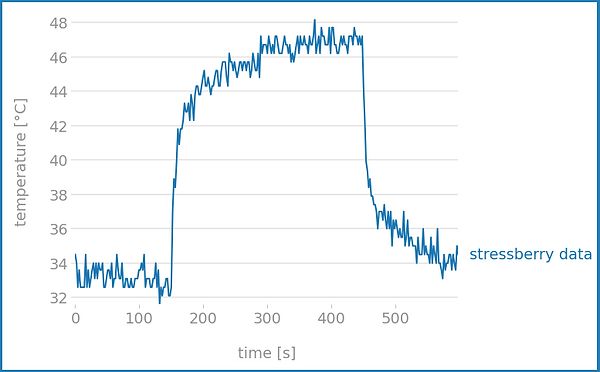
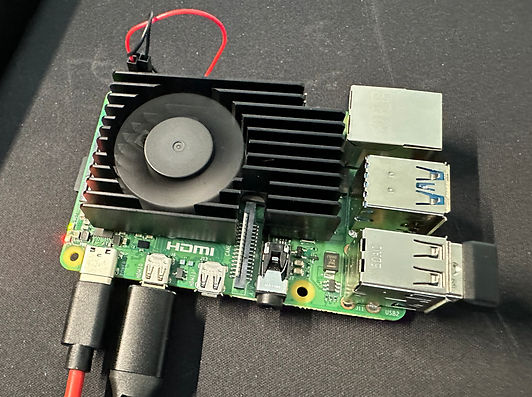
We then move to using an air-cooled system that uses a fan and a heat sink to remove the heat from the processor.
The following were the results again overclocking the CPU to 1800MHz.
48°C or 118.4°F Using Air-cooled System
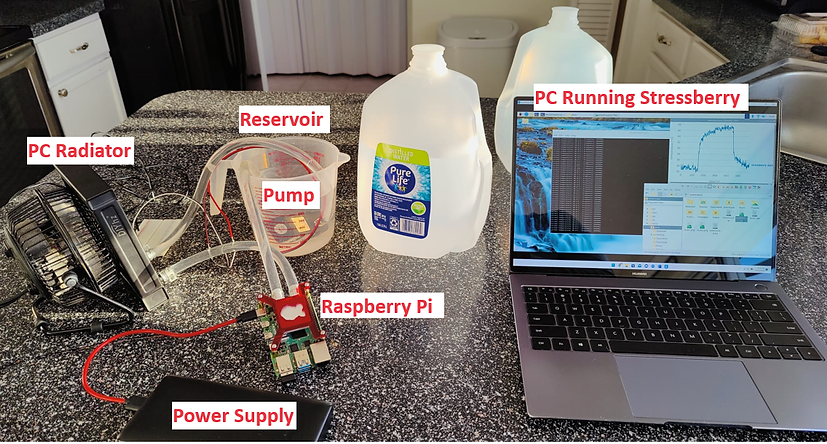
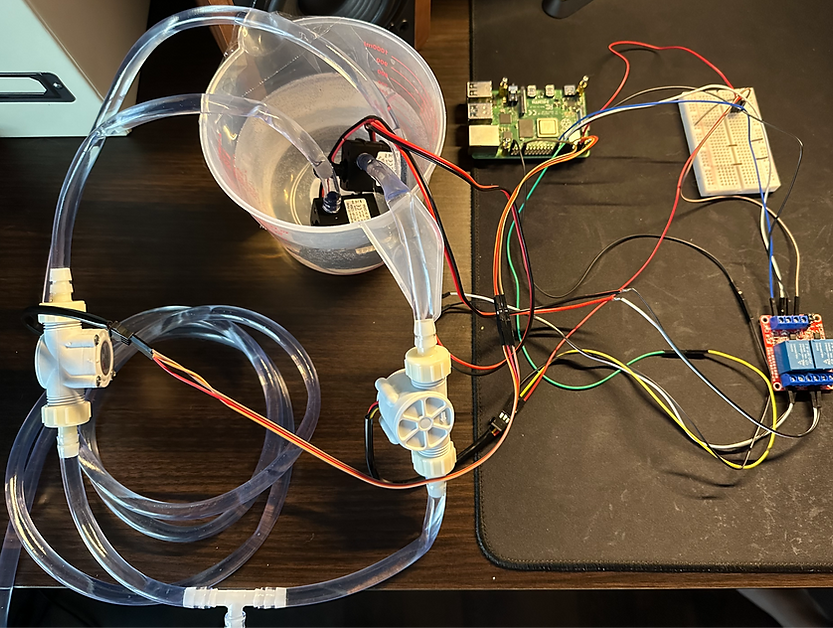
Finally, we executed the test with our advanced water-cooling configuration. We utilized a 120mm computer radiator submerged in water, along with a single pump to facilitate the flow of water from the reservoir, through the water block, then through the PC radiator, before returning it to the reservoir. It's worth noting that our method diverges from conventional systems, which rely on air-based cooling with a fan.
The following were the results obtained from using the water cooling solution.
39°C or 102.2°F Using Water-cooled System
Conclusion: Based on the experimental findings, we concluded that our system can keep CPU temperatures about 16 degrees Fahrenheit lower than the other air cooling solution. Additionally, it was observed that even better results can be achieved by substituting the thermal pads with thermal paste, as it serves as a superior heat conductor.
Alexis:
To initiate a stress test on the Raspberry Pi, the initial task was to install the Raspberry Pi OS on the device. This was achieved by following a detailed guide provided on the official Raspberry Pi website [6].
Once the Raspberry Pi OS was successfully installed, the subsequent step involved the installation of Stressberry, a software developed by Core Electronics. This tool would later serve the purpose of both overclocking and monitoring the CPU's temperature, as well as generating graphical representations of the gathered data. The installation only took a few steps which are referenced here [7] and can also be seen in the video below.
Aside from this work, the weekly meetings entry was added to the website along with correcting the format for the referenced page link.
Leonardo:
Created 3D rendering of the initial idea of how the project should look like using a free software called Vectary [8]. Added information on the Time and Effort table for this week. Fixed some errors on the engineering Specifications table and on the Engineering Requirements table.
Week 6: 09/26/2023-10/04/2023:
Alexis:
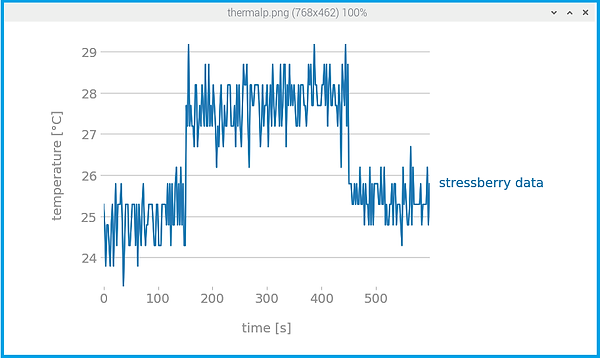
I decided to conduct further testing of the water loop system only this time replacing the thermal pads for thermal paste. Thermal paste has a much higher thermal conductivity hence the results obtained were much better than previously. As can be seen from the graph below.
29°C or 84.7°F Using Water-cooled System and Thermal Paste
Below is a table comparison of the results obtained using each technique for better clarity.
The video below provides a visual overview of the setup used in the test. In this configuration, the water reservoir serves as the container for the circulating coolant that flows through the water block in the loop. Meanwhile, the secondary container, where the radiator is immersed, acts as a heat sink, absorbing the heat generated by the circulating water. The thermostat registers a temperature of 75 degrees Fahrenheit which was the temperature of both bodies of water.
Alongside the testing, the monetary budget was recreated as a table widget, and the corresponding links were added to where each product can be purchased. Added a way to navigate to the latest log entry quicker. Added this week’s meeting summary. Edited the Engineering Specifications table, adding the physical construction of the capsule and moving relays to the Electromechanical module.
Leonardo:
Constructed a Power Budget table and filled in the data for each component in regard to voltage, amperage, and power. Created a modified version of the 3D rendering of the capsule to better display the presence of the glass. Edited modular block diagram to reflect the changes made to the Engineering Specifications table. Reworked the main page summary.
Week 7: 10/04/2023-10/10/2023:
Alexis:
During this week I began working on the User Interface(UI) that will monitor and control some of the elements of the project. I began by looking into a few Python modules that can aid in the construction of a UI, ttkbootstrap [10]brought my attention as it has build in widgets for different types of meters. This is an important element of the UI as we will be monitoring the temperature of two CPUs and the air temperature of the capsule as well as humidity. The UI should also give the user the ability to control which pump to use and also monitor the operations of the different components of the system.
Running the UI on a remote computer:
Since we're using a Raspberry Pi Zero to communicate with various sensors and switches in the system, overloading the Pi with the task of running the user interface would be too demanding. That's why we'll have the user interface run on a standard computer. The Raspberry Pi will simply handle sending sensor data to the computer via Ethernet.
Communication Protocols used:
I'll be employing two protocols for communication between the Raspberry Pi and the User's PC: Remote GPIO and Secure Shell. While Remote GPIO can effectively operate relays and manage LEDs, it lacks support for the temperature sensor we will be using. Therefore, I'll utilize Secure Shell to transmit commands to the Raspberry Pi in order to retrieve sensor data. The two modules that facilitate Remote-GPIO and Secure Shell are the following respectively: gpiozero [11] and paramiko [12].
Paramiko provides an implementation of the SSH (Secure Shell) protocol, which allows communication over an encrypted channel. It enables you to execute commands as well as execute python scripts located in a remote computer. Here is a simple script to stablish a communication with a remote computer.
The need for Multithreading:
As I started adding more elements to the code, I noticed a significant issue. The program began getting stuck, waiting for one task to finish before moving on to the next. This slowdown became especially noticeable when dealing with multiple sensors. To ensure all the sensors could display their data concurrently, the use of multithreading was needed. This technique essentially allows different parts of the program to run simultaneously, solving the problem of tasks getting bottlenecked and ensuring a smooth flow of data across all elements of the UI.
Having successfully tackled these challenges, the following is a brief demo showcasing the program's capability to track CPU temperatures, humidity levels, and air temperature readings.
There are still tasks remaining in the User Interface. I need to establish a proper method for closing the program, ensuring the secure shell sessions are terminated correctly. Furthermore, I must implement a feature to indicate when the pumps have ceased operation.
Leonardo:
For this week, I created the Proposed Detailed Timeline, which specifies what should be done each week, and I also created the Proposed Timeline Chart, which gives an overview of the progress of the project. I also added the details for the seventh weekly meeting and filled the time and effort table for week 7.
Week 8: 10/11/2023-10/17/2023:
Leonardo:
This week I changed the Proposed Detailed Timeline and Proposed Timeline to better match the description of our progress log, including the weeks that we have been doing some prototyping to prove our concept.
Also, I started working on the code necessary for controlling the pumps. The code created has the capability to read both flow sensors and determine whether they have water flowing through them or not. That was accomplished by using the properties of a Hall sensor. Hall sensors have distinguished states when the magnet inside of it is at different positions. This allows us to read those measurements and determine if there is any flow or not, therefore determining if the desired pump is running or not. The way it was coded was by creating a vector with 10 readings and checking if all of those readings were the same or not. If they are the same it means that the magnet inside the sensor has not moved, therefore there is no flow of water through it. If the readings change it means that there is water flowing through it. The code appends to the vector one reading every 0.1 seconds, so for the code to determine if there is any flow of water it will take a total of 1 second. After it determines if there is any flow of water or not, the vector with the data entries is reset so that the same process can start over again.
The code is also capable of setting the relays ON or OFF by using the GPIO pins to output 5v to the relays. However, at this point, no logic was implemented as far as automatically switching pumps ON or OFF based on the sensor readings.
This code is being developed using functions, that way, it can be accessed by other parts of the system with ease.
The code developed this week can be found below:
Image of Pilot test for Electromechanical Module:
Alexis:
During of this week, my primary focus was on completing the initial sections of the proposal report. I successfully drafted the introduction, discussed current solutions, and the motivation behind the project.
Additionally, I dedicated time to adapting the User Interface application to run on the Raspberry Pi. This task involved utilizing alternative libraries due to compatibility issues with the Pi.
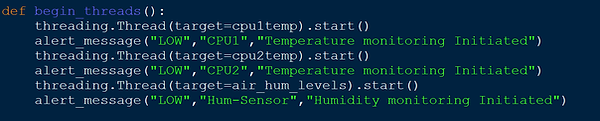
Some of the additions that were made to the code this week , were adding a monitor button that allowed threads to begin only when asked by the user. As can be seen from the code below the threads are all started when the begin_threads function is called.
Group Threads on Raspberry Pi 4:Combine threads to align with the Raspberry Pi 4's capacity of supporting only up to 4 threads simultaneously.
Reduce Sensor Reading Access Frequency: Minimize how often the code fetches readings from sensors to lighten the load on the Raspberry Pi.
Implement Dictionary for Event Log Messages:
Create a dictionary to store various messages, providing a flexible source for populating the event log.
Week 9: 10/18/2023-10/24/2023:
Alexis:
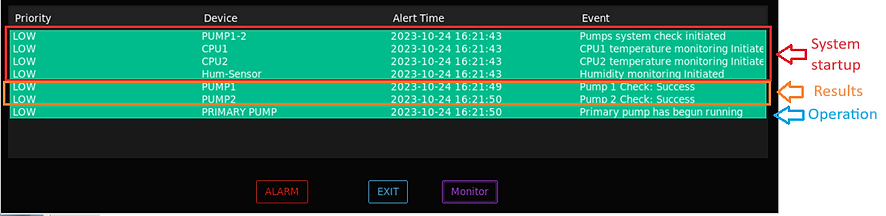
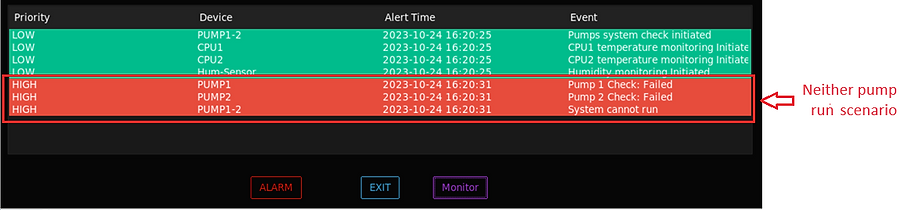
This week, I focused on refining the event log section of the user interface, ensuring it now provides accurate messages for all events related to the operations of both the primary and backup pumps. The event log window begins by displaying the start-up procedures, which includes running the pumps diagnostic check, initiating CPU monitoring, and checking the remaining sensors, refer to image below.
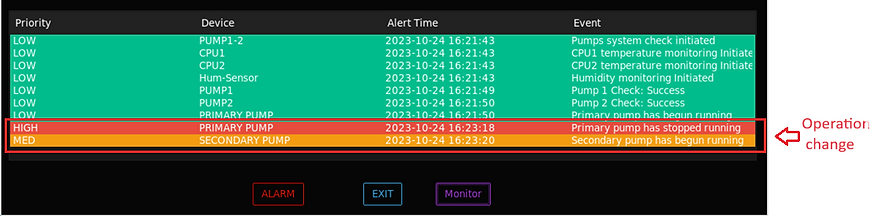
After the system startup process concludes, a separate thread takes charge of monitoring whether the pumps have stopped operating or if a different pump has started running.
In the event that both pumps experience a failure during the startup process, the user will receive a notification indicating that both pumps have not passed the system check, rendering the system unable to operate.
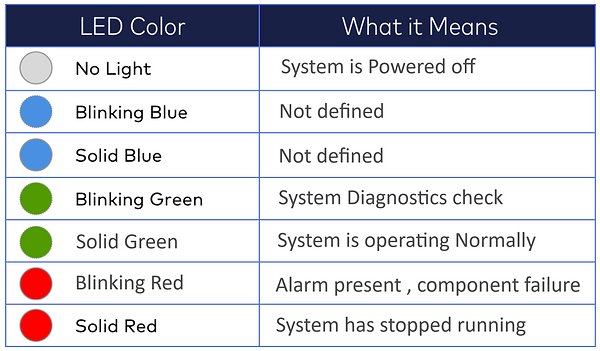
This week, I also worked on incorporating a status LED that provides users with a quick visual indication of the system's current operation based on its color and activity. Green and Red have designated meanings while blue would be worked on in the future. Below is a chart showing what the LED colors mean.
Leonardo:
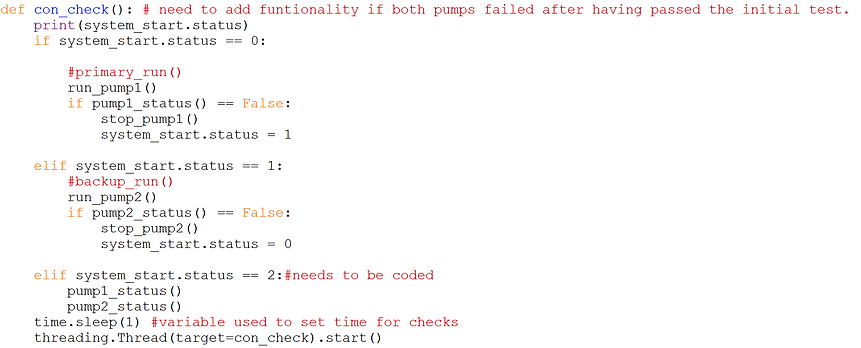
During this week, I started working on implementing the logic for the automatic switching between the two pumps. The logic behind that consists of a system checker that scans both pumps to determine their functionality whenever the system starts. Then, after doing the primary check of the system, a new thread is initiated in order to continuously check the functioning of the pump that was selected during the primary check. If such pump fails, the code is programmed to start the other pump that is idling. It is still necessary to write more code in case both pumps fail while the system is already running and for the user to manually control which pump they wish to use.
Below is the function that starts the system. At first, it runs the sensor check function, which determines whether both pumps are working or not.
Below is the sensor check function.
Finally, the code runs the continuous check function, which runs non-stop in order to determine if there are any failures during operation. This function can be seen below.
Additionally, I also worked on completing the first chapter of the report and filled the time effort table for this week.
Group:
This week, we gathered twice to conduct tests and troubleshoot any issues related to both the pump logic and the user interface. We encountered a few challenges that we needed to overcome, such as ensuring the scripts remain independent of each other while still attempting to use the least amount of threads possible.
Our primary goal was to guarantee that these systems operate independently but can also function together smoothly. The pump logic is responsible for initiating a 10-second pump diagnostic at startup and should also determine which pump to activate initially. All of these events will be communicated to the user interface, which will then display the current running pump, the test results from the startup diagnostic check, and any changes happening in the event log.
The video below is a short demo of both systems working together.
Week 10: 10/25/2023-10/31/2023:
Group:
This week, we gathered one more time to finish working on incorporating the pump logic with the User Interface. Some testing and troubleshooting were performed to make some final adjustments.
Alex:
This week I concentrated most of my efforts on writing Chapter 2 of the Proposal report.
Leonardo:
This week I concentrated on doing the writing for chapters 3 and 4 of the report.
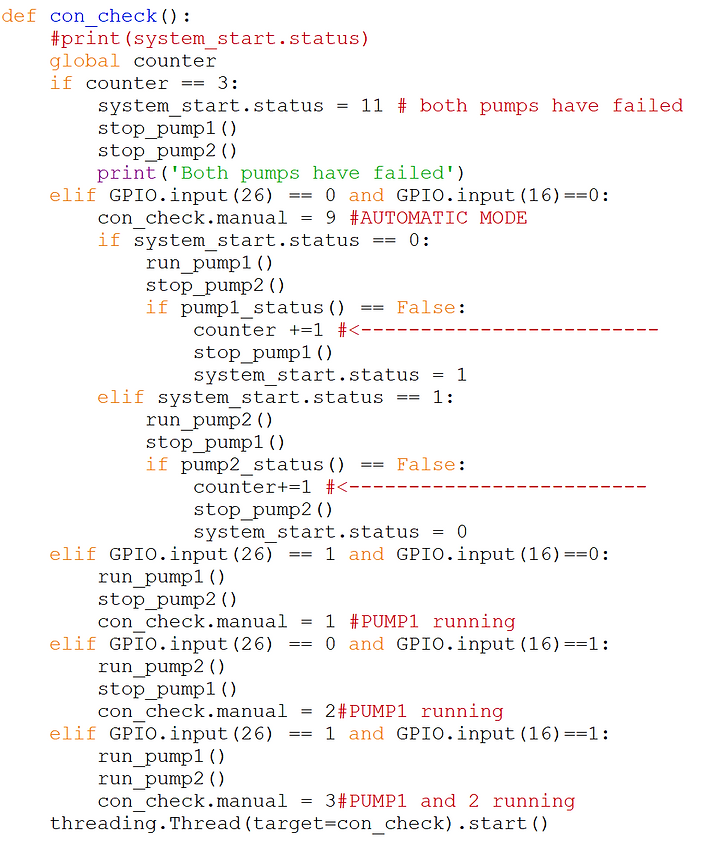
Additionally, I added the necessary manual control for the pump system, allowing the user to select which pump they would like to have running. This functionality was added to the continuous check function, making use of the same thread running that function. This was done by having two different GPIO inputs to detect which pump the user would like running, or even both. The testing performed during our team meeting showed that the system worked as expected. The modified version of the continuous check function will be shown below.
Week 11: 11/01/2023-11/07/2023:
Alex:
This week, my main priority was refining chapters 1 and 2 of the report making all the suggested changes. I introduced a new section that outlines the completed work for the project, offering some more details into the installation of the software and the testing that has been already done. In addition to these updates, I also made minor adjustments to the messaging system for the User Interface. Furthermore, I constructed a detailed flowchart that explains the operational logic of the pump.
Leonardo:
For this week, I focused on finishing Chapters 3 and 4 of the Report by adding the necessary tables and writing one last topic that was missing.
Week 12: 11/08/2023-11/14/2023:
Alex:
This week's primary focus was on completing the proposal report. I finalized the Table of Contents, List of Figures, and Acknowledgment page. Additionally, I incorporated all recommended corrections for Chapters 1 and 2
Leonardo:
Finished chapter 3 and 4 of the report , edited tables to match the rest of the report .
Group:
Began discussing presentations and created an outline of the Power point presentation.
Week 13: 11/15/2023-11/21/2023:
Group:
We met up during the weekend to run a final test of both the Pump logic and the User Interface. We improved the way the system known when to end the program. After two pump failures the system effectively shuts down and displays a message alerting the user. As far as the User Interface we added an extra button to clear the audio alarm when one of the pumps have failed. Finally we referenced the proposal presentations to meet the time requirement and to improve our delivery and clarity. The image below shows a demonstration of the changes made.